 by
by When analysing financial markets, traders rely on various chart types to gain insights into price movements and make informed decisions. Renko charts are one such alternative charting method that offers a fresh perspective on price movement. This article explores MetaTrader 5 or MT5 Renko charts, their unique characteristics, and how they can provide traders with a clear and simplified view of market dynamics.
Understanding Renko Charts
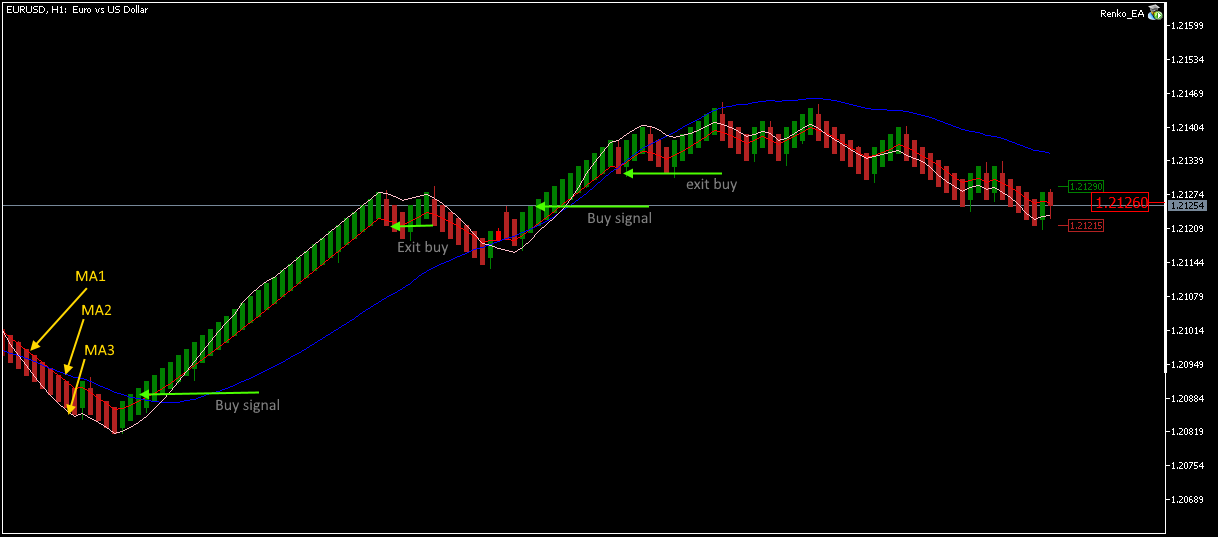
Renko charts originated in Japan and have been used for centuries in various markets. Renko charts are not based on time intervals, unlike traditional candlestick or bar charts. Instead, they focus solely on price movement. In a Renko chart, a new brick, or “box,” is added to the chart only when the price moves a predetermined “brick size” upward or downward.
Simplifying Price Action
MT5 Renko charts eliminate the noise often found in other charts, providing traders with a simplified view of price action. Since Renko charts do not plot any data until a specific price movement occurs, they effectively filter out market noise and minor price fluctuations. This clarity makes it easier for traders to identify trends and critical support and resistance levels, enabling more accurate trading decisions.
Spotting Trends with Renko Charts
Renko charts are particularly effective in identifying trends in the market. When a trend is established, Renko bricks form a series of rising (bullish) or falling (bearish) boxes without reversing in the opposite direction. This visual simplicity allows traders to grasp trend movements, efficiently aiding trend-following strategies.
Determination of Brick Size
The brick size is a critical factor in MT5 Renko charts. Traders can customise the brick size according to their preferences and the market they are trading in. Smaller brick sizes will provide more precise and sensitive price movement indications. In comparison, larger brick sizes will generate more significant trends but at the cost of potentially missing smaller price fluctuations.
Using Renko Charts for Breakout Trading
Renko charts are widely used for breakout trading strategies. Breakouts occur when the price moves beyond a well-defined support or resistance level. Since Renko charts filter out noise and minor price movements, breakouts become more evident and easier to identify. Traders can look for a series of consecutive bricks moving in the same direction, indicating a strong trend, and wait for a breakout in the opposite direction to enter a trade.
Renko Charts and Support/Resistance Levels
Support and resistance levels play a crucial role in technical analysis. Renko charts help traders identify these levels more clearly. Support and resistance lines can be drawn by connecting the highs and lows of the bricks on the chart. These levels become significant reference points for traders in determining potential trade entry and exit points.
Limitations of Renko Charts
While Renko charts offer valuable insights into price movement, they have limitations. One significant limitation is the absence of time on the chart. Traders who rely heavily on time-based analysis may find Renko charts less suitable for their trading strategies. Additionally, Renko charts may not perform well in markets with low volatility, as bricks may need to form more frequently to capture meaningful price movements.
Combining Renko Charts with Other Indicators
Many traders use Renko charts and other technical indicators to enhance their trading strategies. Moving averages, oscillators, and trend-following indicators can complement Renko charts, providing additional trade confirmation signals. As with any chart type, testing and experimenting with different combinations is essential to find the most effective approach for one’s trading style and preferences.
Conclusion
MetaTrader 5 or MT5 Renko charts offer a fresh and simplified perspective on price movement, enabling traders to identify trends and key support and resistance levels. While Renko charts may not be suitable for all trading strategies or market conditions, they offer a valuable alternative charting method for traders seeking a fresh approach to technical analysis. As with any trading tool, thorough testing and understanding of Renko charts are essential for successful integration into a trader’s overall trading strategy.